About Me

Passionate about the markets and Technical Analysis. The learning never stops!

Sunday, March 25, 2018

Where is STI's major support in this sell down?


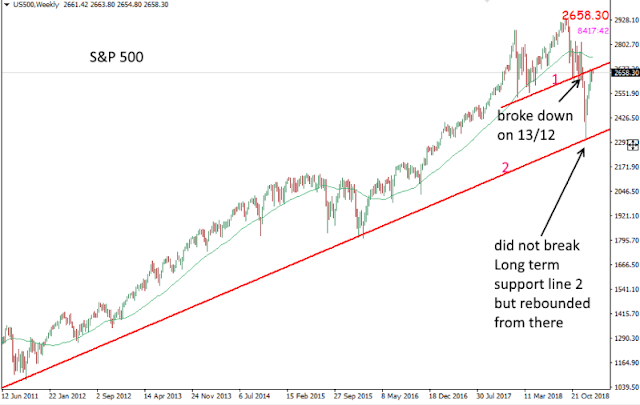
The US market have the 2nd major sell-off within 2 months and STI is not spared. 
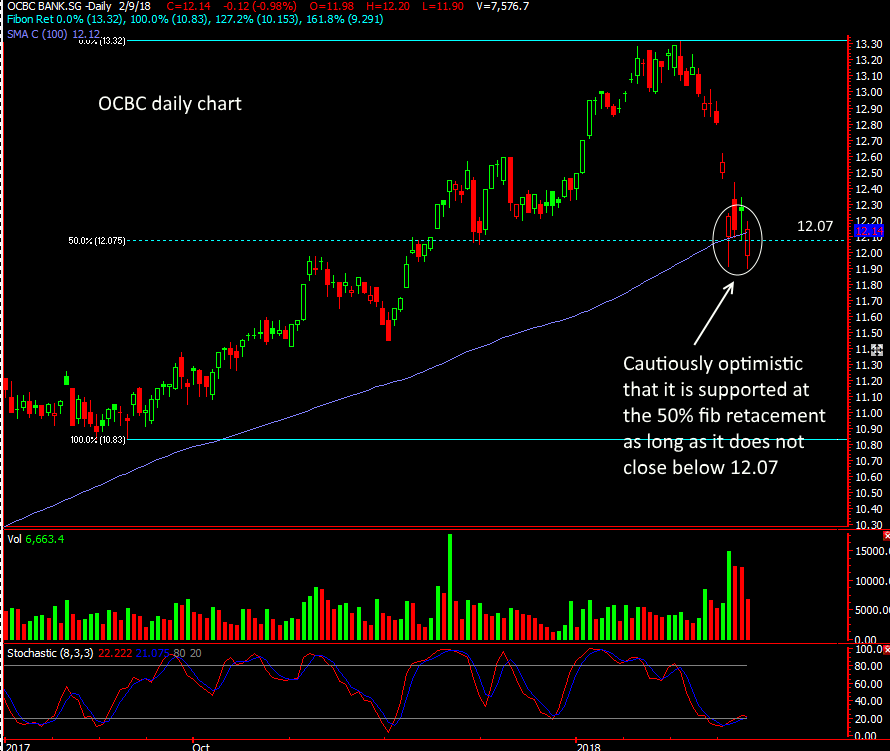
Are we turning bearish? or is it an opportunity to pick up the good stocks (eg banks)?

I am watching out for STI's major support at 3340.  Should our market tested this level and start to rebound from here, then we could be in a "correction" rather than a "bear" mode.

Should STI breach 3340 and did not rebound above it within 2 days, then we need to err on the bearish side, until we see a noticeable change in the overall trend.

STI's support is now at 3340

YZJ head & Shoulders target hit

On 9 Feb 2017, I noticed that YZJ has formed a bearish H&S pattern.  However the ideal opportunity to short this counter came only on 27 Feb when it broke down from the neckline and then rally back up to test this neckline before failing the next day.   From there (about 1.50), it was a 30cts (20%)move towards the H&S target at 1.20 which was hit on 25 March.

In theory, this trade worked out as expected though in actual, it is not easy to sit through ont the way down as it took almost a month with some minor rallies in between. 


YZJ 


Saturday, February 24, 2018

Cosco - Poised for a breakup


Cosco is likely to have more upside this coming week.  It's weekly has just formed a Morning Star pattern (it has formed a similar Morning Star pattern on 5 Jan this year which subsequently propelled it from 0.435 to a high of 0.525 over the next 2 weeks+ (a 20% move).  Will be interesting to watch if this move plays out in the coming weeks.


Cosco weekly


Morning Star Pattern - Bullish

Candliesticks - Morning and Evening Star Patterns

Morning and Evening Star patterns are popular patterns to trade as the probability of success is rather high.  However do note that candlestick patterns are best for short term prediction and I would not rely on it for predicting a long term trend.

A Morning Star pattern is bullish and a follow through to more upside is expected over the next few candles while an Evening Star pattern is bearish and we expect more downside to come over the next few candles.


There are a lot of info about these patterns.  You may like to read more about them here:  https://www.babypips.com/learn/forex/triple-candlestick-patterns

Sunday, February 11, 2018

SingPost - on the road to recovery

Singpost caught my eyes recently as it has formed an Adam & Eve bullish reversal pattern.

A recovery to around 1.70 is plausible for a start, if it is able to rise above 1.70, I will be looking around 2.00-2.10 next.  However, nothing is guaranteed, trail your exits. 
 
Singpost - Adam & Eve (bullish)


Some STI Stocks Coming into Short Term Support levels

There are quite a number now and here are just a few.  However it is likely to be still volatile in the next few weeks. 


Keppel Reit
Keppel Corp
UOB
 

Frasers Property


A Look at S&P and Crude


The US market (Dow Jones, S&P and Nasdaq) have been seeing some buying coming in on Friday night and it looks like we could be heading for some rebound next.  However, whether this is the final low remains to be seen.

A more concrete confirmation that a low has been in place is when either Scenario A or B (as illustrated in the chart below) happens.


S&P


Crude Oil - bottoming yet?

Friday, February 9, 2018

The Markets Had a Big Sell Off, what's next?

The free fall in the markets that started a week ago on Friday (2 Feb 2018) which cumulated to a low on Tues (6 Feb 2019) was a rather huge plunge of 12% for the US markets and 7.5% for STI.

For a fall of this magnitude, I am cautious that the "perma" US uptrend has been disrupted and we can expect volatility ahead. I am still expecting a rally/rebound of blue chips in the coming days and where the next rally ends will give a clearer picture of whether what is happening now is just a much needed correction or a sign that the market is getting toppish.

The market could be finding some support now and I am looking for possible short term upside in the charts below. However, should any of these significant supports be breached, then I will cut and stay out until the dust settles.

(click on the charts for a larger view)

S&P - Finding support at 200 Day Moving Average?


 Straits Times Index


OCBC Bank


SATS


On the Flip side, not all stocks are equal.  Some stocks like YZJ have confirmed a bearish Head and Shoulders formation and could be heading lower in the coming days. 


 YZJ


Disclaimer:
Any view, analysis or opinionexpressed here do not constitute an investment advice nor inducement to trade. It does not have any regard to your specific investment objectives, financial situation and any of your particular needs. Accordingly, no warranty whatsoever is given and no liability whatsoever is accepted for any loss arising whether directly or indirectly as a result of this information. Investments are subject to investment risks including possible loss of the principal amount invested.


Monday, June 26, 2017

Noble Group - Bottoming out with Adam & Eve


Noble Group started to sell off on 24th Feb 2017 and the decend was relentless, hitting the first bottom only 3 months later on 24th May at 0.305.  However it wasn't clear that was bottoming until 19th June when a strong upward bar propelled it close at 0.48 and an Adam & Eve bulllish pattern became apparent. The next couple of days saw a healthy retests of this 'necline' with closes above 0.45.  Expect a recovery trend in the coming weeks.

Sunday, May 14, 2017

Oil & Gas Stocks have bottomed!


The following is our FTSE Index which represents our Oil & Gas stocks.

A lot of our oil and gas stocks have fallen on hard times since late 2014 (Some went into receivership!).   The decline has been relentless in 2015 and in 2016 it started to bottom out.

In Jan this year, it started to break above the "neckline" of an "Adam & Eve" bottoming formation and is looking to be in a sustainable recovery. Adam & Eve is one of my favourite reversal formations.  Read about it here.

I am expecting many of our trodden down (but still surviving) oil & gas stocks to continue on a recovery path this year.  Watch for them!

Adam & Evee


Thursday, May 11, 2017

Imperium Crown - Bullish Right Angle Wedge!


Imperium Crown has been forming a Rising Right-Angle Wedge for the past 2 weeks.  
(read more about this stock pattern here).

Today it looked ready to to break up of this wedge I decided to add to my stake in this counter while it was around 0.106.  Not long after it start to break above 0.108 and what a strong move after that!  It hit 0.12 before profit taking came in and closed at 0.115, still a 10% move from yesterday's close at 0.114.  Not too bad!

Just before breaking up today
Right angle triangle wedge pattern
Imperium Crown - forming a right-angle wedge pattern (4hrly and daily)

Break up!
Imperium Crown - broke up of the wedge strongly!


Sunday, May 7, 2017

Jadason - Potential for Bigger Move

Jadason caught my attend in April as it make s strong move up in late March and then spent the first half of April retracing 50% of the prior move in March.  It found support at this 50% retracement (0.049) and began to propel up again, closing at 0.074.

I will not be too surprised if it needs to consolidate (ie pullback some) from here but the bigger picture (weekly chart) below is suggesting the move is far from over.    

The odds are good that it could reach 0.115 over the next few weeks/months (ie another 55% upside from the current price of 0.074).

I will put a trailing stop as having good odds is not a guarantee that the trade will work out according to my expectations. Always have a safety net and cut loss if it doesn't work out.

Let's see!


Daily Chart of Jadason

Weekly Chart of Jadason  

Friday, May 5, 2017

ADDVALUE - broke up today on strong volume!


I was just looking at AddValue a couple of days ago when it was approaching the green trendline resistence of 0.056.  My expectations was that if it broke above, then we can probably expect it to head towards the projected target of 0.096.  

Today it hit 0.056 shortly before 4pm and buying frenzy came in to push it to close at 0.063 by 5pm! 

Okay, it is unlikely to be a smooth sailing straight line up to the projected target of 0.096, I would expect some consolidations/resistences along the way, esp around 0.075 to 0.088.

I would consider to take partial profits on the way up, plus trail my stop loss upwards as the stock progresses.

broke up on strong volume


Thursday, May 4, 2017

Sheng Shiong - Short term swing target


Shengshiong consolidated for the past 1 month in narrow range before finally make a break above the trendline resistence at 0.985.  

broke up


Based on 100% project of it's prior swing move from this breakup level, I am expecting that this swing will last till about 1.045, which is a 6 cents (6.1%) moves from 0.985.

Let's see!


Swing move


ADDVALUE - poised to break up above 0.056 soon

Addvalue has been steadily building momentum.  It looks ready to break above 0.056 in the near future.  When it does break above (ideally with strong volume), I will be looking at a projected target of 0.096 (71% upside).

p/s as usual, trailing stops is essential on the way up as not all trades will reach projected targets.

Let's see!

posied to break up soon


Wednesday, May 3, 2017

Cityneon - Inverted Head & Shoulders formation (bullish)


Cityneon could be forming an inverted Head & Shoulders (H&S), a potentially bulllish formation, one of my favourite patterns to trade!  See explanation for this chart pattern here.

I have drawn a slanted as well as a horizontal neckline.  Initial entry is at 0.91 (based on the slanted neckline) and should it be able to go above 1.00 (horizontal neckline), then the inverted Head & Shoulders formation is double confirmed.

Should Cityneon be able to break above 1.00, I will look to take partial profits at 1.08 and then 1.20.   Of course, projected target may not materialise (though the odds are quite good with a H&S formation, but odds aren't guarantees), hence trailing stops are still required on the way up.  

Inverted Head & Shoulders Formation

Imperium Crown - broke up into Stage 2 this week!


Imperium Crown broke strongly above 0.084 (yellow dotted trendline) last Thursday (27 April), giving the first indication of a possible trend momentum.  Then yesterday (2 May), it finally broke (strongly) above 0.094 (a horizontal resistence), confirming it's debut into a Stage 2 stock.

Projected target is 0.148.  I will be trailing my profits as it progresses upwards, in case it is not able to reach this target.  So let's check back in a few weeks' time.

broke up into Stage 2

Sunday, April 9, 2017

Chasen Holdings - 113% move in 8 days!

On March 24, I wrote about Chasen Holdings being another stock in early Stage 2 (see my original post here). 

At that time, Chasen was at 0.067.  Just 8 days later, it hit a high of 0.143 (a 113% move!).
It as such a quick strong move and I have decided to lock in the profits. :)

113% move in 8 days


Blackgold Natural Resource - 80% profit in just 2 days!


On March 26, I spotted Blackgold Natural in early Stage 2 (with good volume to boot).  (see my original post here).

Entering it at 0.108, what followed the next 2 days was beyond my expectations!  It shot up vertically to hit a high of 0.195 (>80% move from my entry).  The next day, I saw a possible short term reversal and decided to lock in all my profits at 0.188 (74% gross profit, can't ask for more).

It is now consolidating between 0.170 to 0.195.  The move might not be over yet unless it starts to close below 0.170.  Let's see.

80% profit in just 2 days

Spackman - Follow up on this harmonic swing trade (profitable trade)


On March 26, I spotted a Bulllish Bat/Gartley pattern (see the original post here) and the plan was to enter between 0.16 to 0.163.  The next day, Spackman traded between 0.158 to 0.165, making the entry possible.  However, it continued to whipsaw about between 0.167 and 0.157 for the 7 days (not easy on the emotions, even though the inital stop loss just below 01.54 was not triggered).  

Finally on 6 April, Spackman finally making a decisive move up, hitting a high of 0.182 yesterday!

Entering at 0.163 and taking partial profits at 0.18 would have yielded a gross profit of 10.4% in less than 2 weeks, not too bad.  For the rest, I would advise to trail the stops to just a tick or 2 below the last candle low of 0.175.  I would consider to take another 1/3 (or even all) the profits around 0.19 where there is possible resistence coming up there.  

The more gutsy could attempt to hold to see if it is possible to reach 0.205 (trailing the stops up).


Thursday, April 6, 2017

Koh Eco - Off to a solid start into Stage 2


As I mentioned in my post on 13 Feb that a lot of Penny Stocks are getting into early Stage 2 (the start of a new bull cycle), more and more penny stocks have been breaking out of their base formation.

Here is another one, off to a solid start looking at the huge volume upon the breakup.
However a word of caution, if you have missed entering near the breakup level (in this instance it is at 0.101), then do not chase blindly in..  Wait for some consolidation to accumulate.

Koh Eco broke up on strong volume


Tuesday, April 4, 2017

Net Pacific - Accumulation going on

Look at Net Pacific.  Strong volume in the past few weeks... waiting for a break above 0.08.


Net Pacific with huge volume waiting to break up

Jubilee - Another Penny Stock in accumulation mode


Since the begining of this year, a lot of pennny stocks have been in accumulation mode and gaining momentum in the last few months.  Here is another one moving into Stage 2


Tuesday, March 28, 2017

Stocks waiting for a breakup - Tritech


Here are a few more stocks potentially getting into Stage 2 of the bull cycle to watch out for.  However, until they break up and depending on the volume, the momentum could differ. 

Tritech stock - potentially bullish


Sysma is potentially bullish


Terratech is potentially bulllsih

Sunday, March 26, 2017

Blackgold Natural Resource - early Stage 2

Blackgold Natural Resource has broken into stage 2 (above 0.08) with strong volume.  So far it is sustaining.  Way to go.

BlackGold Natural Resources share price

Spackman - Bullish Bat / Gartley Pattern for a swing up


I am looking to long Spackman (in the region 0.160 to 0.164) as it has formed a Bulllish Bat / Gartley Harmonic Pattern on it's chart.  

Looking for a possible swing target of 0.174 to 0.205  (6.7% to 16.7% respectively) from it's last close at 0.163.  

The initial stop loss will be placed 2 ticks below 0.154 (ie 0.152).  If it is able to reach 0.174, I am looking to take 1/3 profits and trail the remaining positions by moving my stops upwards.


Friday, March 24, 2017

Chasen Holdings - broke up into Stage 2!


Chasen Holdings broke above a longer term resistence of 0.062 with formidable volume yesterday.  It is certainly potential for a good run especially if it could clear the next resistence zone (0.073 to 0.086).  Watch out for it.

However, a word of caution: note that this stock is on SGX's watchlist.  If the technicals come true, they could be off the watchlist in due course.  Let's see!


Wednesday, March 15, 2017

STI - near term headwinds around 3160


A word of caution here.  STI could be facing some resistence around 3160 in the near term.

This is both a fibonacci 61% retracement up of the last peak-to-trough as well as a horizontal resistence (this level it was a previous support in 2014 but broke down in 2015).


US Crude Oil Inventory Report out tonight . How will it play out for oil stocks?


The price of Crude Oil suffered a steep plunge after the latest the Weekly Petroleum Status Report showed that US crude oil inventories had risen to an all-time high.


Is the picture getting bearish for Crude Oil?  Technically, the charts of Crude Oil (and similarly Keppel Corp and Sembcorp Marine) are at critical junction.  Is it in danger or an opportunity to long right now?


We might get an inkling after tonight's inventory report. 


Friday, March 10, 2017

Property Developers that are in (early) Stage 2


Today, the government has announced some easing on Seller's Stamp Duty as well as removing the Total Debt Servicing Ratio requirement for an equity loan that is 50% or less. 

This may be only a baby step in the easing of our property cooling measures but is enough to sent most of the property stocks surging.

Our property counters are at various levels of the cycle, but are some that are still in rellatively early Stage 2 and likely to have good room to move in the coming months.


Bulls are back!

The US markets declined pretty sharply on 13th December last year but 2 weeks later it hit into a longer term support and started to rebo...