About Me

Passionate about the markets and Technical Analysis. The learning never stops!
Showing posts with label *TA101 - Adam&Eve pattern. Show all posts

Sunday, January 27, 2019

Bulls are back!


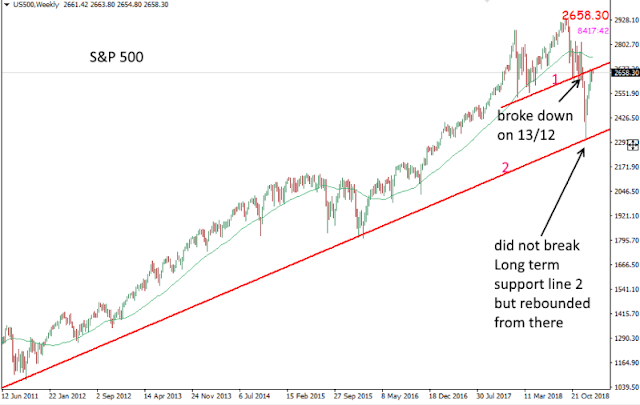
The US markets declined pretty sharply on 13th December last year but 2 weeks later it hit into a longer term support and started to rebound (just as sharply).  Right now while it is stil lbelow the 200 days moving average, the chance of it recovering above the 200 days MA is looking pretty plausible

Note: 
When prices are above 200 days Moving Average (market is biased toward bullishness)
When prices are below 200 days Moving Average (market is biased towards bearishness)


Our Straits Times Index (STI) has been on the decline since it peaked on 2/5/18, finally hitting bottom at the start of this year.  Due to the long 8 months of sluggish markets, many of the stocks are now looking good for some uspide with bullish reversal patterns.


Straits Times Index


Examples of some charts with bullish reversal patterns (ie odds of the chart sustaining further upside is high).

City Development


Frasers Property


Venture Corp

SATS


Disclaimer: remember that while the odds are high for a stock with bullish reversal pattern to be profitable, it is not guaranteed.  A stop loss is still necessary should the trade not work out.

There are a lot more bullish looking stocks now.  Good luck!

Sunday, February 11, 2018

SingPost - on the road to recovery

Singpost caught my eyes recently as it has formed an Adam & Eve bullish reversal pattern.

A recovery to around 1.70 is plausible for a start, if it is able to rise above 1.70, I will be looking around 2.00-2.10 next.  However, nothing is guaranteed, trail your exits. 
 
Singpost - Adam & Eve (bullish)


Monday, June 26, 2017

Noble Group - Bottoming out with Adam & Eve


Noble Group started to sell off on 24th Feb 2017 and the decend was relentless, hitting the first bottom only 3 months later on 24th May at 0.305.  However it wasn't clear that was bottoming until 19th June when a strong upward bar propelled it close at 0.48 and an Adam & Eve bulllish pattern became apparent. The next couple of days saw a healthy retests of this 'necline' with closes above 0.45.  Expect a recovery trend in the coming weeks.

Sunday, May 14, 2017

Oil & Gas Stocks have bottomed!


The following is our FTSE Index which represents our Oil & Gas stocks.

A lot of our oil and gas stocks have fallen on hard times since late 2014 (Some went into receivership!).   The decline has been relentless in 2015 and in 2016 it started to bottom out.

In Jan this year, it started to break above the "neckline" of an "Adam & Eve" bottoming formation and is looking to be in a sustainable recovery. Adam & Eve is one of my favourite reversal formations.  Read about it here.

I am expecting many of our trodden down (but still surviving) oil & gas stocks to continue on a recovery path this year.  Watch for them!

Adam & Evee


Sunday, February 26, 2017

Semcorp Marine - sustainable recovery if above 1.90


An Adam & Eve pattern is forming on Sembcorp Marine.   This is a potentially bullish pattern, confirmed upon breaking above the neckline at 1.90 .

This stock has been in a down trend since hitting a high of  $5.46 in 2012 and since then, it has seen a number of rallies that failed.  The formation of an Adam & Eve pattern now is potentially a harbinger that it's worst could be over.  A break above 1.90 would confirm this.


Bulls are back!

The US markets declined pretty sharply on 13th December last year but 2 weeks later it hit into a longer term support and started to rebo...