About Me

Passionate about the markets and Technical Analysis. The learning never stops!
Showing posts with label SembCorp Marine. Show all posts

Wednesday, March 15, 2017

US Crude Oil Inventory Report out tonight . How will it play out for oil stocks?


The price of Crude Oil suffered a steep plunge after the latest the Weekly Petroleum Status Report showed that US crude oil inventories had risen to an all-time high.


Is the picture getting bearish for Crude Oil?  Technically, the charts of Crude Oil (and similarly Keppel Corp and Sembcorp Marine) are at critical junction.  Is it in danger or an opportunity to long right now?


We might get an inkling after tonight's inventory report. 


Thursday, March 9, 2017

SembCorp Marine - 2nd chance to stake


After my last post about Sembcorp Marine (SM), it broke up above 1.90 and hit 2.08 within 3 days (9.5%).  However it then started to retrace and came all the way back to the initial breakup zone.

If you had miss the chance to stake earlier, this is your 2nd chance to stake.  It is normal for a stock to break up strongly above a resistence level only to see it come back down to "square one" a few days later.  This can happen due to "noise" in the market, in this case it is due to the fear that US' relentless oil production will send oil price free-falling again.

As this stock is still at a relatively low base, (ie early stage 2), then there is a reasonably good chance it will continue on the uptrend after re-testing this breakup level. 

Today at 1.87-1.90 is probably our 2nd chance to enter with a stop loss placed slightly below 1.85.   


Sunday, February 26, 2017

Semcorp Marine - sustainable recovery if above 1.90


An Adam & Eve pattern is forming on Sembcorp Marine.   This is a potentially bullish pattern, confirmed upon breaking above the neckline at 1.90 .

This stock has been in a down trend since hitting a high of  $5.46 in 2012 and since then, it has seen a number of rallies that failed.  The formation of an Adam & Eve pattern now is potentially a harbinger that it's worst could be over.  A break above 1.90 would confirm this.


Bulls are back!

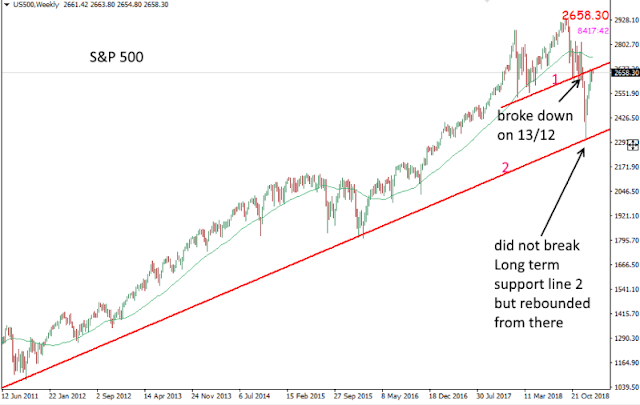
The US markets declined pretty sharply on 13th December last year but 2 weeks later it hit into a longer term support and started to rebo...