About Me

Passionate about the markets and Technical Analysis. The learning never stops!
Showing posts with label Dow Jones. Show all posts

Sunday, January 27, 2019

Bulls are back!


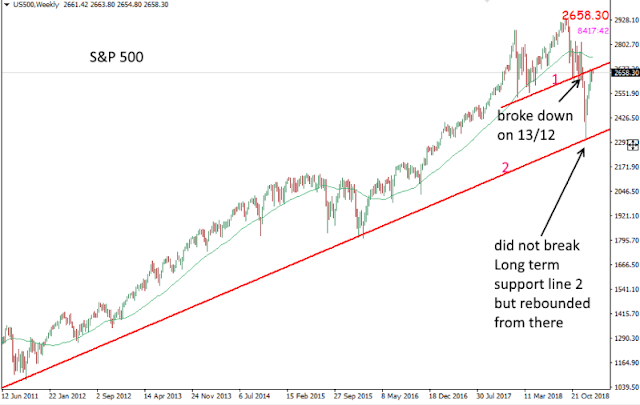
The US markets declined pretty sharply on 13th December last year but 2 weeks later it hit into a longer term support and started to rebound (just as sharply).  Right now while it is stil lbelow the 200 days moving average, the chance of it recovering above the 200 days MA is looking pretty plausible

Note: 
When prices are above 200 days Moving Average (market is biased toward bullishness)
When prices are below 200 days Moving Average (market is biased towards bearishness)


Our Straits Times Index (STI) has been on the decline since it peaked on 2/5/18, finally hitting bottom at the start of this year.  Due to the long 8 months of sluggish markets, many of the stocks are now looking good for some uspide with bullish reversal patterns.


Straits Times Index


Examples of some charts with bullish reversal patterns (ie odds of the chart sustaining further upside is high).

City Development


Frasers Property


Venture Corp

SATS


Disclaimer: remember that while the odds are high for a stock with bullish reversal pattern to be profitable, it is not guaranteed.  A stop loss is still necessary should the trade not work out.

There are a lot more bullish looking stocks now.  Good luck!

Friday, December 14, 2018

US markets could be rolling over

Since my last post 2 months ago warning that markets could be topping out, there have been pockets of hope as rebounds came just as intensely.  However, the huge volatilities that have plagued markets for most of this year is usually an ominent sign that markets could be toppish.  

Early this month, US and China announced a trade war truce for 3 months and a few days ago, China announced that it is cutting US car tariff to 15% (a whopping reduction from 40%).  All these should bring cheer and optimism to the markets and yet it did not. The warning signs that all is not well are there.  We will need to see a major lift from current levels before we know the worst is over.

The charts of various major markets indices speaks for itself.  Most are poised to roll over. Perhaps only the Chinese and Hong Kong markets (which had been beaten down to low levels now) may not suffer as much and maybe even be finding their footings.  

Will STI follow the East (China and Hong Kong) or the West (US and Europe)? It remains to be seen.  Watch for the critical support level for STI at 3000.  Any breach of this level means it's better to stay safe and stay out for now. (Unless you are an astute short term trader :) )


Straits Times Index


Dow Jones forming a Double Top (potentially bearish)


Nasdaq forming a Head & Shoulders (potentially bearish)


German Dax is already in bear territory


Nikkei 225 - Formed a Double Top (potentially bearish)

Hang Seng Index - Bearish but could be bottoming out


Wednesday, October 10, 2018

Caution - Markets Could be Topping Out


11 October 2018

The US market has been hanging on the verge for the past 5 days before finally giving way to a whopping 3.15% plunge last night.

A closer look reviewed that the Dow Jones is forming a potentially "Double Top" while the German Dax has formed a "Head & Shoulders", both of which are "bearish" formations.

Where does that leave STI?

STI hit the top on 2 May this year and has been on a slow decline since.  What looked like months of
"consolidation" for which I was looking for possible near term support around 3040 might be in danger of breaching at the moment, a breach of which could bring it towards 3000, if not 2500.  Caution!


The STI is vulnerable to external shocks.  Expect more volatility in the days ahead.


Potentially bearish Double Top forming in DJ and S&P.   Whether the neckline holds remains to be seen.


Dax is on the verge of breaking down the H&S neckline and if it does, then the ball is set in motion for the bear to continue towards the 10000 level at least.


Sunday, February 11, 2018

A Look at S&P and Crude


The US market (Dow Jones, S&P and Nasdaq) have been seeing some buying coming in on Friday night and it looks like we could be heading for some rebound next.  However, whether this is the final low remains to be seen.

A more concrete confirmation that a low has been in place is when either Scenario A or B (as illustrated in the chart below) happens.


S&P


Crude Oil - bottoming yet?

Friday, February 9, 2018

The Markets Had a Big Sell Off, what's next?

The free fall in the markets that started a week ago on Friday (2 Feb 2018) which cumulated to a low on Tues (6 Feb 2019) was a rather huge plunge of 12% for the US markets and 7.5% for STI.

For a fall of this magnitude, I am cautious that the "perma" US uptrend has been disrupted and we can expect volatility ahead. I am still expecting a rally/rebound of blue chips in the coming days and where the next rally ends will give a clearer picture of whether what is happening now is just a much needed correction or a sign that the market is getting toppish.

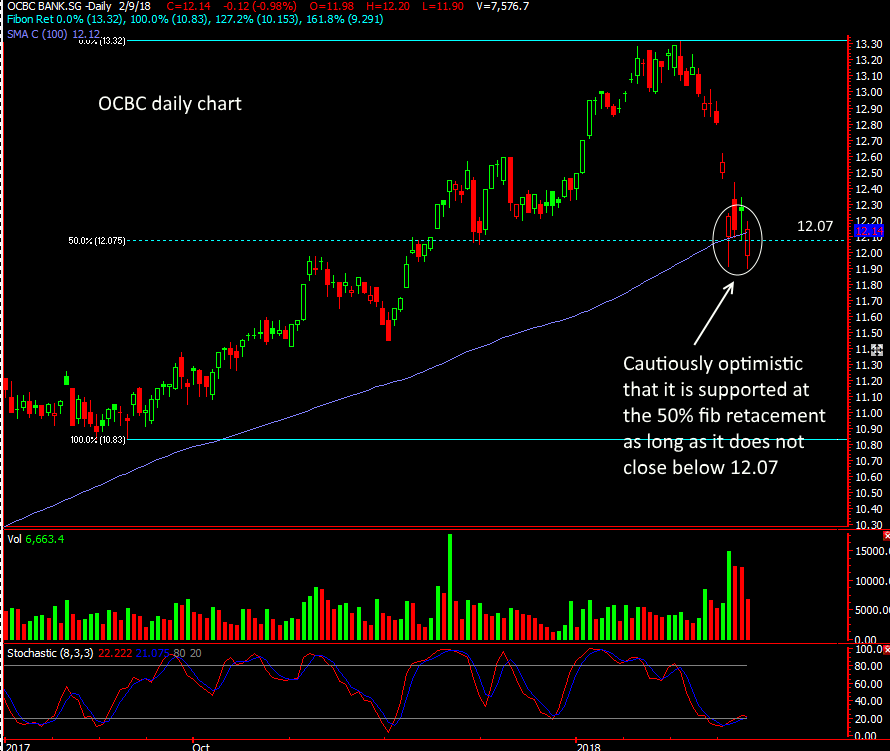
The market could be finding some support now and I am looking for possible short term upside in the charts below. However, should any of these significant supports be breached, then I will cut and stay out until the dust settles.

(click on the charts for a larger view)

S&P - Finding support at 200 Day Moving Average?


 Straits Times Index


OCBC Bank


SATS


On the Flip side, not all stocks are equal.  Some stocks like YZJ have confirmed a bearish Head and Shoulders formation and could be heading lower in the coming days. 


 YZJ


Disclaimer:
Any view, analysis or opinionexpressed here do not constitute an investment advice nor inducement to trade. It does not have any regard to your specific investment objectives, financial situation and any of your particular needs. Accordingly, no warranty whatsoever is given and no liability whatsoever is accepted for any loss arising whether directly or indirectly as a result of this information. Investments are subject to investment risks including possible loss of the principal amount invested.


Wednesday, July 22, 2009

Inverted H&S?

After the huge move last week, I now see a possible inverted H&S on the DJ. This could have validity as it has formed over a nearly 8 mth period (from the valleys of the left to the right shoulder).

Should it hold above the neckline in the next week or two (or worst case is a retracement of 38.2% from low of Jul13 to current peak to about 8600), then I could be looking at a possible longer term upside target of around 11245 (61.8% retracement up of the entire Oct07 to Mar09 bear move) to 11330 (inverted H&S target).

Strong Rebound from 13 Jul 09


Right after my observation posted on 13 July, both DJ and Light Crude made quite a spectacular "recovery".

Monday, July 13, 2009

Bullish Divergence in DJ


Saw this on 13 July 09, before US markets open. Looks like a bounce in DJ is imminent with the bullish divergences. Want to see if it can propel it above the H&S neckline especially now that the weekly stochastics are at oversold and possibly turning up again. Could mean a negation of the recent H&S breakdown if that happens?

Many have been calling for a retest of March's low (or even new lows) recently. I have been skeptical though as I have been cautiously bullish (esp on STI) since 4 May 09 when it went above the horizontal resistence at 1950 (for STI). Nevertheless, the bottoming of a bear market and the start of the next bull is always a treacherous period and I am mindful of a possible wave 2 correction (with a higher low than March's low) happening before the uptrend could resume.

Bulls are back!

The US markets declined pretty sharply on 13th December last year but 2 weeks later it hit into a longer term support and started to rebo...