This is both a fibonacci 61% retracement up of the last peak-to-trough as well as a horizontal resistence (this level it was a previous support in 2014 but broke down in 2015).
About Me
- Ju
- Passionate about the markets and Technical Analysis. The learning never stops!
Wednesday, March 15, 2017
STI - near term headwinds around 3160
This is both a fibonacci 61% retracement up of the last peak-to-trough as well as a horizontal resistence (this level it was a previous support in 2014 but broke down in 2015).
Subscribe to:
Post Comments (Atom)
Bulls are back!
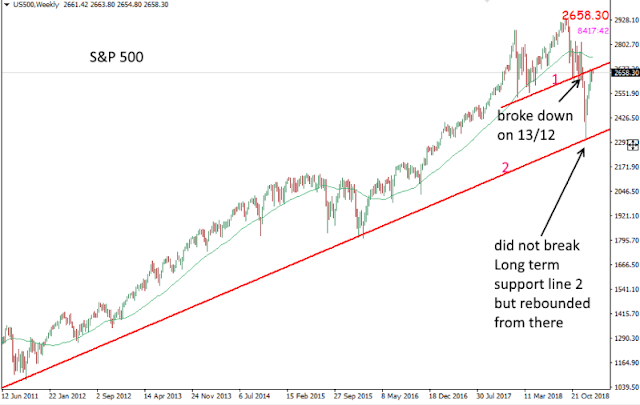
The US markets declined pretty sharply on 13th December last year but 2 weeks later it hit into a longer term support and started to rebo...
-
Noble Group started to sell off on 24th Feb 2017 and the decend was relentless, hitting the first bot...
-
An Adam & Eve pattern is forming on Sembcorp Marine. This is a potentially bullish pattern, confirmed upon breaking above the neckli...
-
Look at Net Pacific. Strong volume in the past few weeks... waiting for a break above 0.08.

No comments:
Post a Comment