About Me

Passionate about the markets and Technical Analysis. The learning never stops!

Saturday, February 18, 2017

Wilmar - breaking above $4.00 soon?


Wilmar has already advanced 60% from $2.50 at the start of Oct 2016 till now,  
It has been consolidating between $3.85 to $4.00 for the past month but is looking ready to break above $4.00 soon .


How much more upside?   If we look at the bigger picture of Wilmar (way back from 2010), 
the projected target is around $5 (another 25% upside).  It is probably not going to be an explosive move like a number of the penny stocks though.  Let's check back some time later to see if this stock progress as expected!  (p/s if it falls below 3.70 in the near term,  then the bullish outlook will no longer hold).


Thursday, February 16, 2017

SembCorp Industries - Poised to break up


Sembcorp Industries was on the recovery track after forming an "Adam & Eve" bottom.

The trend is now up with a bullish consolidation flag completed recently when it retraced from 3.30 back to 3.07.  Am expecting it to break above 3.30 in the not too distant future.


Wednesday, February 15, 2017

Hyflux - Turning the corner

Hyflux was in a long downtrend since 2011 but was already turning the corner when it established a "double bottom" (a potentially bullish pattern) in late 2016 at 0.45.

There is strong volume building up since 2016.. a good sign that a bottom is in place. 
For a confirmed uptrend, wait for a break above 0.65 (a horizontal resistence).   The odds are looking quite good.  Let's wait and see.

I like to trade chart patterns.  There are some well know patterns that we need to give attention to when we see them as they could be giving a hint that a major trend could be emerging.

Head & Shoulders / Inverted Head & Shoulders and Double Tops / Bottoms  are one of those.

See also: Chart Patterns 101

p/s I know what you are thinking.. "how nice if I had bought it at 0.45!".  Well, the problem with buying low is that we never know if that is the rock bottom (unless you are "smart money").  You may end up seeing a new low after you have bought. :(

Hence, it is okay to buy "more expensive" as long as the odds are good that it will get "even more expensive" in the coming future.  That doesn't mean we chase a rising stock mindlessly.. how to enter (and how to exit,this one is tougher!)..that will be another topic I plan to write about.


Commodities Bulls Underway


It seems many down and trodden commodity stocks are really starting to fly!

Alliance Minerals, GSS Energy, Geo Energy Resources, Noble Group.. to name a few.

Is it a Trump effect?  I don't know and I don't care.  I only care what the charts tell me.

A check on the major commodity ETF (exchange traded funds) review that Crude Oil, Agricultural Produce and Metals have all hit rock bottom last year and are all now just embarking on an uptrend (Crude and Agriculture) or already in a trend (base metals).

No wonder these penny stocks are running!  The smart money knows.

see also: Chart Patterns basics

          Crude Oil 


                   Agriculture


                 Base (Industrial) Metals


Tuesday, February 14, 2017

Noble Group - Broke up on strong volume today


Noble Group broke up on high volume today!


It opened at 0.225 but dipped briefly back to 0.21, giving a great opportunity to stake near the breakup level.

The  projected initial target is about 0.300, which is about 40% upside! 
Will it come true?  Nothing is guaranteed though the odds are reasonably good. We can only wait and see.  

The support is at 0.197.  Any near term retest of the price at 0.197 is healthy as long as it does not dip any lower than 0.195.  

previous post on this stock

Monday, February 13, 2017

Penny Stocks Are Getting Bullish

A number of our penny stocks are entering into an early bull phase (Start of Stage 2) of the market cycle.  Time to get on board for the ride (don't wait till it's too late!).

check out: 4 Stages of a Market Cycle


This is the FTSE Catalyst Index.  Do you see the transition from Stage 1 (bottoming process) to Stage 2 (uptrend)?   The longer the bottoming process, the stronger the Stage 2 when it emerges.
However, not all the stocks that are starting to rise from rock bottom are Catalyst stocks, some are actually Main-Board listed too.

Tips:
1. We don't necessarily want to park our money when it is still forming a base, we could end up waiting for forever for the stock to get into Stage 2 (some might never!).

2.Wait for the stock to get into Stage 2 to get the best bang for our buck.  But don't wait too long to see a very obvious and established uptrend before we jump onboard.

3. Not all stocks that are emerging from the bottom are created equal.  We want to look for certain characteristics that ensure a higher chance of a successful trend.  A high level of accumulation by smart money(ie marked increased volume) just weeks (and up to a couple of months) before breaking up is a good sign.

4. The ride can still be volatile!  Even in an uptrend, there are pullbacks along the way.  If you have already missed the initial breakout, either you wait for a pullback to enter or trade smaller amounts so you can endure any pullbacks that might happen soon after you enter.

5.  Take some profits along the way but don't take all too quickly if you spotted a stock in early Stage2.  You may end up missing most of the move.  Entering is easy, exiting is the tricky part.

6.  Lastly, not all trades will pan out as expected, even with charts showing the best odds.  We need to cut loss and move on if the stock started to act badly and sunk below near term support levels.  Do not hold and pray (and eventually forget).  With the right odds, there are many that will work out, why sacrifice the forest for that one lousy tree?


Noble Group - waiting to break up?


Noble Group has yet to break out of it's base.  Let's wait and see if it wil break above 0.21 soon before entering.  I would also want to see good volume if and when it breaks up.  Otherwise, it could end up being just a mediocre stock.

Mermaid Martime


Mermaid Maritime is now clearly in Stage 2 (uptrend).  It first broke out of a base at 0.14 in early Dec 2016 and has been steadily climbing since.   You might want to watch this stock and see if it can pull back a little before jumping on board.   There is support around 0.200.

p/s a stock that drops back below "support" usually means bad news and time to cut loss.

GSS Energy - Ran today, but room for more


GSS Emergy broke strongly above the 1st resistence at 0.107 to close at 0.120.  There is another resistence coming up at 0.126 which it will need to break above for the long to continue.

Do not chase blindly, preferably wait to see if there is some pullback to enter.
The support is now at 0.107.  Do not buy if it goes below this level.

Dyna-Mac - waiting for a break above 0.215


Waiting to break above 0.215 for the longer run with near term support at 0.185.

ArtiVision


A break above 0.32 would confirm the up trend.  Coming Soon?

4 Stages of a Market Cycle


Basically there are 4 stages of Market Cycle / Stock:

Stage 1. Accumulation by smart money
Stage 2. Trending up (bullish)
Stage 3  Distribution by smart money (topping out)
Stage 4. Decline (bearish).


Not all stocks are at the same stage at the same time.  They market may go by sectors or industries.

Typically the blue chips are the first to emerge from a market bottom into Stage 2 while the penny stocks may start to run when the blue chips are starting to churn at the top.

Stage 1
Came about after a prolonged downtrend when the stock has bottomed out.  Sellers are no longer interested in selling and some "value" buyers have come in.  But basically the stock can drift sideways for a long time until there is enough impetus to propel it into a new trend.


Stage 2
Usually just before the stock breaks into Stage 2, there is some stealth accumulation by smart money   These are usually investors who are "in the know".  Perhaps the company is finally turning around or has some angel investors coming in. Mostly likely the the volume has been steadily increasing for several weeks and finally it broke decisively up!   

However, in early Stage 2, no one will believe the breakup is for real!  The fundamentals being reported are likely to be still bad, the outlook still sucks.

But by late Stage 2, the picture is very different, everyone is talking and dreaming about these stocks and how easy it is to make money.  The media is likely giving it lots of coverage too.  

Stage 3
Finally the stock begins to churn sideways as the smart investors who bought early is slowly selling the stock (which is likely way overpriced by now and with fundamentals already priced in and appears stretched).


Stage 4
It may start with a sharp or slow decline.  Everyone believes it is only a temporary correction. The fundamentals are probably still good. "Sucker's rally" happen along the way to give suffering investors renewed hope, and they may even average down!  After a short relief, the stock declines further, the pain intensifies and finally there is panic selling, especially when it is near the bottom.  When all hopes are lost and sellers have finally cut or given up selling, the market hits bottom and finally drifts into Stage 1 again.


Well, the above are the textbook scenarios.   There are times when the stages are just not so easy to identify and we will probably have swing trade for smaller profits rather than attempt to hit (or hope for) a home run.   Hence we need to be flexible as well. 

However, when I do see a stock with clear staged 1 formed and has just moved into Stage 2, with all the criteria in place, then I will hang on for a bigger ride (with trailing stops in place).

Sunday, February 12, 2017

Back from Hiatus

Hiatus from Blogging, not Trading :)

It's been more than 6 years since I last attempted to blog about the markets, and it's been more than 10 years since I embark on this journey of trading.  There is just so much to share and still so much to learn.  

I trade mostly Singapore stocks but watch the world markets and commodities for overall direction. 

The market comes in waves and when it does come, ride the trend early!  

When I have the time, I will share with you about
1. Why I use Technical Analysis
2. The 4 stages of a Market Cycle and why it is important to know which stage we are in.
3. Money Management (very important!) and any other tips and experiences that are important to surviving trading over the long term. 
4. etc

This blog is still in developmental stage and is very "raw" right now.  I just wanted to post on some opportunities that is sprouting up right now and hope you managed to catch part of this wave as well. 

However I would caution that not all stocks featured will work out as expected (despite having better odds).  Hence do cut loss if it does not pan out as expected.

Feel free to drop me your comments! :)


Wednesday, July 22, 2009

Inverted H&S?

After the huge move last week, I now see a possible inverted H&S on the DJ. This could have validity as it has formed over a nearly 8 mth period (from the valleys of the left to the right shoulder).

Should it hold above the neckline in the next week or two (or worst case is a retracement of 38.2% from low of Jul13 to current peak to about 8600), then I could be looking at a possible longer term upside target of around 11245 (61.8% retracement up of the entire Oct07 to Mar09 bear move) to 11330 (inverted H&S target).

Strong Rebound from 13 Jul 09


Right after my observation posted on 13 July, both DJ and Light Crude made quite a spectacular "recovery".

Monday, July 13, 2009

Bullish Divergence in DJ


Saw this on 13 July 09, before US markets open. Looks like a bounce in DJ is imminent with the bullish divergences. Want to see if it can propel it above the H&S neckline especially now that the weekly stochastics are at oversold and possibly turning up again. Could mean a negation of the recent H&S breakdown if that happens?

Many have been calling for a retest of March's low (or even new lows) recently. I have been skeptical though as I have been cautiously bullish (esp on STI) since 4 May 09 when it went above the horizontal resistence at 1950 (for STI). Nevertheless, the bottoming of a bear market and the start of the next bull is always a treacherous period and I am mindful of a possible wave 2 correction (with a higher low than March's low) happening before the uptrend could resume.

Oil at short term support


Crude Oil hitting support around the 58.15 (38.2% retracement of the Feb-Jun upmove) and the 59.40 (double top target) region. Due for a bounce next. Any bounce in oil will boost DJ since a few of the latter's components are the oil majors.

"Experts" are predicting that oil will pull back to an eventual low of around $45 before resuming it's uptrend (ie any bounce now is still a sucker's rally). Crude's weekly stochastics are now only down to about 40.. not quite oversold yet though I'm skeptical it'll pull back to as low as $45 but I could be wrong! So let's see..

Bulls are back!

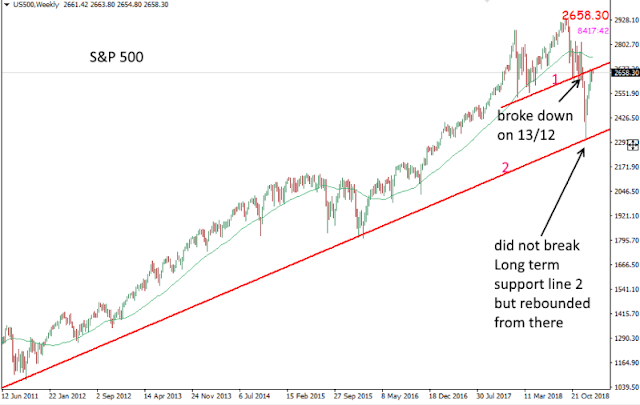
The US markets declined pretty sharply on 13th December last year but 2 weeks later it hit into a longer term support and started to rebo...